In this paper I look at the effects of the UK’s national minimum wage on non-university educated 18-21 year olds. I find that the effects are generally negative, with a significant disemployment effect amongst the young and unskilled, whereby general levels of youth unemployment have consistently increased since the minimum wage has been increased above particular productivity levels. There are also major underemployment and training-deficit effects, where hours are usually cut irrelevant of the wider economic picture and there are forms of labour-labour substitution which favour trained, older workers over those entering the labour market. Fundamentally, the minimum wage does not help non-university educated 18-21 year olds in gaining skills, entering the labour market or finding long-term employment. Further, it entangles labour markets, negating their functioning as mechanisms that create employment dynamics. In this respect, I recommend reforms which decentralise the minimum wage toward smaller politico-economic units, allowing for disaggregated knowledge to inform decisions on the minimum wage’s effects.
Most of academia and politics seems to ignore the effects of the United Kingdom’s national minimum wage, with debate being stifled and almost nonexistent. Many academic papers that have focused on the UK’s minimum wage have suggested that if we look at the minimum wage in general we see little effect on employment or even the labour market overall. However, these studies have missed the negative consequences it has for 18-21 year olds, particularly individuals in low-skilled or elementary occupations who have not gone into higher education. Simply categorising unemployment as the main effect creates complete ignorance of the other, more subtle effects of a minimum wage, such as underemployment, reduced job growth and a lack of training for young workers. The effects on youth unemployment that the minimum wage either creates or adds to are in themselves significant. Even if it were true that in the aggregate, general employment is minimally affected. Yet this simplified view doesn’t take into account the specifics of the labour market, in particular that young people have a relatively precarious position within the market, due to their lower skills and lack of experience.
This report will explain and identify the effects that the minimum wage has on the employment prospects of young people, specifically non-university educated 18-21 year olds. I will empirically show that national minimum wage has had a significant negative impact on employment prospects, using theoretical evidence showing the economic impacts of a minimum wage alongside detailed secondary data as well as raw data. The main negative effects I will identify are the unemployment effects, the underemployment effects, the masking effects where full-time work is decreased and temporary work is increased, as well as other effects such as slowed job growth and a decrease in training for workers entering the labour market. Finally, I will look into policy proposals which could be reasonably implemented even in a political climate where arguments over the effectiveness of the minimum wage are anathema. These would include regionalising, as well as potentially optionalising the minimum wage for 18-21 year olds for a period of months or years, allowing for training and the development of a secure position in the labour market.
Literature Review
I will draw on theoretical studies of the minimum wage, as well as reports on the UK’s national minimum wage and more specific academic studies that focus on its employment effect. These include Neumark and Wascher’s work, in particular their 2003 report Minimum Wages, Labour Market Institutions, and Youth Employment: A Cross-National Analysis, as well as the work of Neumark with the IZA which documents the effects of the minimum wage in a general sense. Both of these reports give an overview of the global evidence on the employment effects of the minimum wage. Following this I intend to use the Low Pay Commission’s reports into the effects of the UK minimum wage on youth employment and business growth, as well as the effects of underemployment that are caused by the minimum wage. Bourne and Shackleton’s report for the Institute of Economic Affairs gives both a theoretical grounding for and empirical evidence of the negative effects of a minimum wage in the United Kingdom. These reports and studies give a good theoretical base for my research. For secondary evidentiary resources I used Tim Worstall’s on the link of the minimum wage with increased youth unemployment. I’m also using tables and data compiled by the Low Pay Commission within a few of their previous reports as well as ONS and government data that again shows either potential or realised negative consequences.
The general trajectory of research on the minimum wage focused on the general aspects ignoring the effect these policies have on particular demographics. One of the main studies that has focused on a specific demographic was the Dickens, Riley & Wilkinson paper A Re-examination of the Impact of the UK National Minimum Wage on Employment where it was shown that the minimum had a negative impact on the employment retention of part-time low-skilled female workers. This being the main specific report within the academic research on the UK minimum wage, I believe that this paper will open up further debate, as I intend to show that the negatives impacts of minimum wage policies in the UK have a wide range of effects on 18-21 year olds, including unemployment, underemployment, a move away from full-time work and other statistically significant effects.
The Youth Employment Effects of the Minimum Wage
The general trend of youth unemployment within the UK had been steadily increasing, with a sharp spike in unemployment among 18-21 year olds during the recession, but since 2013 we’ve seen lower rates. However it has not dropped to below pre-recession levels (Index number 1). This can partially be explained by higher economic growth coming out of a prolonged recession. However, it should be noted that the statistics for 18-21 year olds only show unemployment falling to pre-recession levels and that since then it has again flatlined and even marginally increased in some months since 2013, similar to the trends seen before 2008 (Dar, A. 2015, 2). The Trades Union Congress themselves have recorded from 1999 “that in the last 12 years, the number of 18 to 24-year-olds who are out of work has risen by 78 per cent, while unemployment across all age groups has increased by 42 per cent” (Worstall, T. 2012). This rise began in 2004(Index number 1), the peak of the economic boom, where we see the trend of increased youth unemployment begin. This suggests that trends in youth unemployment, while picking up recently, are still very poor in comparison to general economic activity, particularly pre-2007 and post-2013, both periods of significant economic growth.
One of the main reasons for this can be seen in what is called the bite of the minimum wage, defined by the Low Pay Commission as “the minimum wage as a proportion of median earnings”(LPC, 2004, 10). The LPC goes on “a high or growing bite means that employers are more likely to be affected by the NMW. It may indicate an increased risk that the minimum wage will reduce demand for labour – that it will cost jobs – because of wage bill impacts on employers” (LPC, 2004, 10). It’s generally accepted that the bite rate for minimum wages are above 50% of median earnings. Within the UK, the minimum wage has generally floated around the 45-50% mark for general earnings of every employee in the UK, thus the effect on overall employment is minimal as previously mentioned. However, when it comes to youth employment, the minimum wage for 18-21 year olds is a large proportion of that group’s median earnings. 18-20 year olds are paid what is called the youth development rate, which currently stands at £5.13. Tim Worstall’s work on the minimum wage shows that in 2011 the youth development rate was £4.98, with 18-21 year olds’ average earnings at that time being £7.62. This meant that this age group’s minimum wage was 65% of their average earnings, well above the bite rate (Worstall, T. 2011). This obviously had an effect on the high youth unemployment figure during the recession, where youth unemployment rose considerably to nearly 22% (Index number 1). This can also be seen in general statistics on the value of the minimum wage compared to real average earnings, where Bourne and Shackleton have shown that it has increased by 75% while average earnings have only increased by 61%, as seen in figure 1.
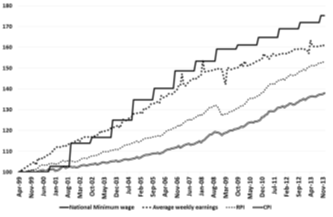
Figure 1: National Minimum Wage, Average Weekly Earnings and Price Indices (Apr 1999 = 100); Source: IEA report – The Minimum Wage P.22
This shows that the minimum wage has a large bite effect, particularly compared to average earnings and the Retail Price Index and has significant negative effects on general employment trends, particularly for lower-skilled, 18-21 year olds. The IEA report shows this bite effect in terms of long-term youth unemployment, which has gone from “14.4 percent in April 1999 to 19 per cent prior to the financial crisis” (Bourne, R. & Shackleton, J.R. 2014, 23-24). This is a substantial rise during a time of consistent economic growth, which can’t just be pinned down to the NEET phenomenon, as there is still a substantial unemployment rate for those that aren’t in training or education. The LPC has noted this effect too, reporting that “there has been a continuous decline in their employment rate since 2000, accompanied by a steady increase in their inactivity rate and, since 2004, a sharp rise in their unemployment rate. Overall, 554,000 or 32.2 per cent of 18-21 year olds not in FTE were unemployed or inactive, compared to 26.3 percent in 2000” (LPC, 2007, 80). The same report also noted that the inactivity rate of 18-21 year olds not in full-time education went from being the lowest in 1998 to the highest in 2007 (LPC, 2007, 80). Again, these trends were during a time of continued economic growth from 1999-2007. General employment trends were extremely positive and yet youth unemployment rates continued to go up. While many pro-minimum wage activists and economists dismiss this as irrelevant, it can only be concluded that due to the high bite of the minimum wage on 18-21 year olds, their employment prospects are significantly reduced, thus increasing unemployment, particularly long-term unemployment.

Figure 2: Occupations of Young People aged 16-24, October to December 2011; Source: Labour Force Survey – Office for National Statistics
The bite of the minimum wage has an appreciable effect on the lowest-skilled occupations, many of which 18-21 year olds occupy. For example, Bourne & Shackleton note that “those with no qualifications likewise saw their unemployment rate increase from 12.1 per cent in 1999 Q1 to 17 per cent by 2011 Q3” (Bourne, R. & Shackleton, J.R. 2014, 24). Looking at figure 2 we see that nearly 20% of all the working 16-24 year olds are in elementary occupations, with nearly another 20% in sales and customer service. This would suggest that the minimum wage bite would have a significant effect on low-skilled occupations, with the youngest workers being the worst effected due to their tenuous position in the labour market. If we look to the stakeholders’ view that is recorded in the 2007 LPC report, we see the CBI reporting “more CBI members in retail were affected than before” and “a fifth said they would have to reduce staffing levels” (LPC, 2007, 52). Further the Federation of Small Businesses has noted a negative effect on employment, with 36% of respondents saying they will have to reduce employment levels due to the increased costs of an enlarged minimum wage (LPC, 2007, 55). The suggestions, supported by theoretical evidence, are that not only are employment prospects significantly diminished as a result of a minimum wage, but that continued increases in the minimum wage create unemployment, particularly amongst workers in elementary occupations such as retail and sales as well as in SMEs, who are lumped with amplified employment costs. If we look to the main theoretical model of the minimum wage, that of a competitive labour market, what we would tend to see is a move away from labour to capital due to the increasing cost of labour. However, this simplistic view doesn’t paint a full picture, and instead what we see is labour-labour substitution, where “employers will substitute away from less-skilled workers toward more-skilled workers after a minimum wage increase” (Neumark, D. 2014, 2-3). This is low impact in statistical terms, and explains why we don’t see large employment effects in the aggregate, yet significant employment effects in more marginal groups, particularly among working 18-21 year olds.
This applies to the UK, where we see more firms upskilling workers and relying on productivity gains, moving away from young, first-time workers. Neumark and Wascher’s study shows that evidence on the minimum wage suggests reduced and even negative employment elasticities for young workers. For example, they identify via controlled variables in cross-sectional analyses of multiple countries that the elasticity for 15-24 year olds is -0.13. For 15-19 year olds, they find it to be -0.25 (Neumark, D. & Wascher, W. 2003, 10). These are statistically significant variables that suggest a negative effect on young workers’ employment prospects, in particular on teenagers. This is backed up by research done by Brown, Gilroy and Kohen, identifying that a 10% increase in the minimum wage that can result in an unemployment effect of 1-3%, with the authors noting that the lower end of that spectrum is a more accurate representation of such negative effects (Brown, C., Gilroy, C. & Kohen, A. 1982, 524). This report again suggests that there is a negative correlation between minimum wage increases and teenage employment. UK youth unemployment continually rose even during a time of high economic growth in the mid-2000s suggesting a considerable causal relationship between minimum wage hikes and increasing youth unemployment.
Additional theoretical work continues to show negative effects, even when the labour markets contain imperfect information. This supposedly suggests a monopsony-type situation. However, economic data has suggested that low-skilled sectors (those most likely to be effected by minimum wage laws) are highly competitive so employees wouldn’t earn much less than their actual marginal product. Even within this model, there are effects on employment levels, with it being supposed that “in this framework, jobs last more than one period and are being created and destroyed all the time: the effect of a minimum wage is felt on both job creation and job destruction (or hiring and firing)” and “a reduction in hiring rather than sacking existing workers may be the optimal response to the introduction of the minimum wage” (Bourne, R. & Shackleton, J.R. 2014, 16). This then implies that instead of simply creating unemployment, there are elements of job consolidation where employers simply stop hiring and increase the productivity of their current workforce, negatively effecting 18-21 year old employment as they’re first time entrants into the labour market. An IMF working paper has given an international perspective to the minimum wage debate, showing evidence that “Higher minimum wages relative to median wages comes with higher youth unemployment by 0.4 – 1.2 percentage points…young people have, on average, been at a disadvantage in countries where the minimum wage is relatively high as a percentage of median pay” (Banerji, A., Saksonovs, S., Lin, H. & Blavy, R. 2014, 15). Neumark’s work shows a general trend evidence that follows the idea that minimum wage laws generally have a negative effect on youth employment, stating “studies suggesting that “we just don’t know” often summarize the literature by citing one or two studies finding positive effects…However, the piles of evidence do not stack up evenly: The pile of studies finding disemployment effects is much taller”(Neumark, D. 2014, 5). The theoretical evidence appears to show negative trends for youth employment.
Looking to countries that don’t have a minimum wage, we see much better youth employment trends. Germany is a good case in point, with youth unemployment being at 7.1%, compared to the UKs which is hovering around 15%. If we look to figure 3, we see that youth unemployment has been falling since 2005, with a slight rise during the recession, yet continuing to fall since September, 2009. This may come down to very high training rates for young workers in Germany, where they can upskill easily and gain a fast-track into full-time employment. Germany has high trade union membership levels as well, but this doesn’t necessarily explain away low German youth unemployment.
I believe a significant influence on their low levels has been a lack of a minimum wage which allows for flexibility and much more on the job training, this being a significant part of Germany’s ‘dual system’ of training. Further, the levels of training seen in Germany could easily be a result of no minimum wage, as such a policy has a negative effect on preliminary job training. Steve Hanke’s work provides further evidence for this, showing that European countries without a minimum wage have an average youth unemployment rate of 19.5%, while European countries with minimum wages had an average rate of 27.7% ( Hanke, S. 2014) (See Index number 2). This again suggests that minimum wage laws have a negative effect on youth employment, and that a lack of such laws allows for flexibility and training in labour markets and consistently low youth unemployment rates, even during recessions.
Underemployment Caused by the Minimum Wage
Another major effect of the minimum wage that is not studied to the extent unemployment effects are, is underemployment. Underemployment is where workers are working less hours than they would actually desire, or where workers are overqualified in relation to their occupation. The evidence that the minimum wage has contributed to this is clear and consistent. For example the Institute for Social and Economic Research showed in their study that “the effect is most evident among the youth group, where we find that the upratings reduced basic weekly hours by around 3-4 hours. However there is little evidence that this impact was greater during the recession than in the pre-recessionary period” (Bryan, M., Salvatori, A. & Taylor, M. 2012, 24). This not only suggests a general negative effect for young workers, but that the effect is present even during the pre-recession period. Looking to the statistics on young workers who are underemployed, we continue to see this trend. The IPPR notes that “of those involuntarily in part-time work in 2009Q4, nearly one in four were between 16 and 24 years old. This rises to over one in four who were involuntarily in temporary work” (IPPR, 2010, 4). Further it is noted that 16-24 year olds are twice as likely to be in part-time or temporary employment than any other age group.
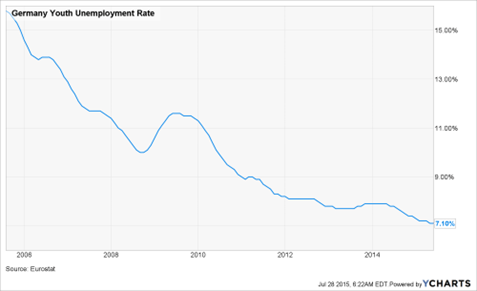
Figure 3: Germany Youth Unemployment Rate Chart ; Source: Y Charts – https://ycharts.com/indicators/germany_youth_unemployment_rate_lfs
There is also the recent prevalence of zero-hours contracts, particularly in their use for young workers. The Labour Force Survey recently showed 39% of 16-24 year olds on zero-hours contracts want to be able to either get another job, work more hours or have another job where they can work more hours (Index number 3). This is a significant amount of underemployment within the British labour market. These increases can be seen as a response to the raising of the NMW, with employers cutting hours for their staff. Bourne and Shackleton note this effect, stating that “This is backed up by HM Treasury analysis which shows that since 2007, the growth of weekly wages for NMW wage workers has tended to be below the growth in the NMW (hourly) rate (BIS, 2014). There is some evidence that hours worked by young people fell as a result of minimum wage increases during the recession” (Bourne, R. & Shackleton, J.R. 2014, 24-25). There has also been a trend for businesses to put 18-21 year olds straight onto the national minimum wage rather than the youth development rate. This could be an explanation for why more employers are using more temporary forms of employment as getting a young worker on the youth development rate requires more regulatory hoops to jump through, thus they are encouraged to employ a younger worker part-time or temporarily as it means they can afford to pay them the full NMW. Overall, the UKs minimum wage has had a significant underemployment effect, moving lower-skilled 18-21 year old workers into more precarious forms of employment despite a desire to work longer hours.
Move Into Precarity and Away from Employment for 18-21 Year Olds
As mentioned in the previous section, the minimum wage has created incentives for employers to move more inexperienced workers who are typically young into part-time or temporary work. This has created an underemployment effect, but more importantly a general move to temporary employment for 18-21 year olds. There has also been a move towards more 18 year olds moving into further education or economic inactivity. Further, the prevalence of apprenticeships, particularly since the Coalition government took power, has shown the need for below minimum wage positions for training purposes. This in some ways has created what I call a masking effect, where the employment effects of the minimum wage are masked by young people choosing or being forced to do different things rather than look for full-time employment. This is caused by the disincentives created by the minimum wage to look for employment, as well as potentially explaining why youth unemployment figures, while significant, aren’t huge.

Figure 4: Manchester’s Full and Part Time Employment for 18-21 Year Olds and the NMW rates for 2004-2014; Source: Collation of data from Bourne, R. & Shackleton, J.R. 2014, 20 & ONS data – http://www.ons.gov.uk/ons/about-ons/business-transparency/freedom-of-information/what-can-i-request/published-ad-hoc-data/labour/may-2015/index.html – 004171 21 May 2015
A clear example of this can be seen in the full-time and part-time employment figures in Manchester. To give some background, the minimum wage in relation to median earnings in the North West is 0.58, and for private sector earnings this rises to 0.65 (Bourne, R. & Shackleton, J.R. 2014, 26). These figures are well above the traditional bite of the minimum wage of 45-50%, where the main effects of unemployment and underemployment are most felt. Looking at figure 4, we see these effects playing out. There has been a consistent general move from full-time to part-time work in Manchester, with the proportion of full-time jobs decreasing consistently from 2005 to 2013, while part-time positions increased with the exception of 2007 and have been decreasing since 2011. The decrease from 2011 seems to be part of a general trend of increased youth unemployment up to 2014, as full-time employment stagnated in the same period. Of particular interest are the 2005-2006 figures, where we see significant increases in both the NMW and the youth development rate. We can also refer back to figure 1, where we see that the minimum wage rose above real earnings, producing a bite effect. This is explanatory of the employment rates and differentials seen in Manchester. The ISER study can also shed light on this, as they identified that hours were cut by 3-4 hours before the recession and 4-5 hours during the recession due to minimum wage increases (Bryan, M., Salvatori, A. & Taylor, M. 2012, 22). In general these are trends around the UK, with 16% of 18-21 year olds being on temporary contracts (CPC, 2014, 3) as well as the CPC noting “among those whose main activity is ‘employed’ (i.e. excluding students) almost one third of women aged 18-21 and one in five men aged 18-21 are working part-time” (CPC, 2014, 3). Hours have been significantly cut for 18-21 year olds, with many who aren’t in university occupying part-time or temporary employment. The CPC further shows that “Among young men aged 18-24, three times as many routine/semi-routine workers are working part-time compared to those in managerial and professional jobs” (CPC, 2014, 3). The effects of minimum wage increases have the effect of increasing part-time and temporary work at the expense of full-time positions. This limits the opportunities of 18-21 year olds within labour markets, and entrenches them in precarity and low pay.
Another masking effect is the relevance of NEET individuals (those who aren’t in education, employment or training) as well as the economically inactive amongst those who are NEETs. In terms of the NEET effect, on average 11.6% of 17-19 year olds were classed as NEET between 2011 and 2015[1]. This is a significant statistic if you consider that apprenticeship enrolment has gone up and entry into university education has increased. We see similar trends with economic inactivity, whereby an individual is not involved in the labour market, thus being unemployed and not actively looking for employment. The numbers are quite constant, with some outlying variables, such as jumps in July-September 2011, July-September 2013 and July-September 2014, with 90,000 to 110,000 17-19 year olds being classed as economically inactive[2]. A similar trend is happening with full-time education, where young people are increasingly going into full-time education, partly due to the instability created in labour markets by the recession. This is noted by the ONS, who in their Young People in Work report state “At the onset of the recession in 2008 there were further increases in young people choosing to remain in mainstream education, as the labour market started to weaken and limit job opportunities. This pattern has continued through to 2012” (ONS, 2012, 2). The LPC themselves had noted that during the recession the NMW had had a larger bite effect, thus creating more instability and precariousness in the labour markets for younger workers. The evidence then illustrates the minimum wage has a negative effect on employment retention and underemployment. Thus it must be concluded that the minimum wage, with its unintended consequences that are put upon young workers, is the cause of the effects of economic inactivity, a move into full-time education and the NEET phenomena.
Other Effects
There are multiple other negative effects of the minimum wage. These can include a negative effect on training, both on-the-job and preliminary, a reduction in wage differentials, a potential increase in exploitative work (work that pays below the national minimum) and a negative effect on job growth within business. Looking at training, we already see some evidence presented by Neumark and Wascher that the minimum wage has a negative impact on training. They state that on preliminary job training “for 16-24 year-olds as a whole and 20-24 year-olds separately, the coefficient estimates are nearly always negative” (Neumark, D. & Wascher, W. 1998, 21) and that for training in general “for young workers in their early 20s’s, the estimated effects indicate elasticites of the incidence of formal training with respect to the minimum wage ranging from about -1 to -2, implying sizable deleterious effects of minimum wages” (Neumark, D. & Wascher, W. 1998, 25). Similar effects play out in the UK, where there is a rise in the number of apprenticeships for young workers. This shows a need for sub-minimum wage training placements so as to effectively train first-time employees. The current apprentice rate is £2.73 for 16-18 and 19 year olds (Gov.uk, 2014), which suggests that for young, inexperienced individuals to be trained effectively they must be paid below the minimum wage as their marginal product doesn’t equal the higher rate.
Other effects seen are a reduction in wage differentials between paygrades and slowed job growth, particularly for businesses who want to grow but can’t afford the increased hiring costs. The LPC reports that retailers have had to reduce pay differentials and even compress wages. They state “Over the years we have often heard from retailers and organisations representing them that a consequence of increases in the NMW has been to narrow differentials between grades…some parts of the sector in particular face wage compression from NMW upratings, such as in department stores and certain geographical regions” (LPC, 2014, 45). This creates job consolidation, as a lack of significant pay differentials means a potential lack of motivation for promotion. The LPC specifically noted that there was a reduction in pay differentials between basic retail roles and supervisory roles, and that businesses are reporting this as being caused by higher hiring costs due to the minimum wage. Similar effects are seen with job growth, where the LPC has noted a significant cost to businesses, such as in retail where it was reported that the increase in the NMW in 2007 created a cost of £1.7 billion (LPC, 2007, 65). The care home sector has also taken a hit, with it being reported that the “UKHCA estimated an annual loss to the sector of £78 million arising from the failure to retain trained workers, part of which could be ascribed to the sector’s inability to afford higher wages” (LPC, 2007, 66). Job retention and growth are impacted negatively by NMW increases, meaning that first-time workers (who are usually young) will have trouble staying in one job or even getting hired in the first place.
There has been a statistically significant proportion of jobs held by 18-20 year olds that pay below the minimum wage. Currently 2.9% of this demographic are employed below the minimum wage (ONS, 2014, 2) (Index number 4). This is linked to the NMW, as businesses will begin to rely on more ‘grey market’ work, such as cash-in-hand and unrecorded, temporary work as young employees are low-skilled and inexperienced and not necessarily worth the minimum wage. Hikes in the minimum wage will mean more grey market work.
Conclusion & Policy Proposals
The theoretical and international evidence shows a correlation between negative employment prospects, such as increased unemployment and reduced hiring by firms. Combined with UK evidence of youth employment trends since the introduction of the NMW, there seems to be a significant causal relation between increasing minimum wages and decreased employment prospects, particularly for the lowest skilled young workers. The same can be said for underemployment and the general increase in part-time and temporary work for low-skilled 18-21 year olds, where theoretical evidence has shown a clear link between a reduction in hours for employees and rises in the minimum wage. Evidence from the LPC such as the stakeholders’ views adds to this analysis, showing that businesses have taken a significant hit due to the NMW. This has also led to masking effects, such as an increase in economic inactivity and a move towards full-time education for 18-21 year olds due to uncertainty in the labour market. Finally, we see other, smaller effects such as a rise in apprenticeships to compensate for the negative effect minimum wage increases have on training, as well as slowed job growth, reduced pay differentials and more sub-minimum wage employment for 18-21 year olds.
If we are to improve these figures, and kick-start more employment/employment opportunities for non-university educated 18-21 year olds, we need to look into politically feasible changes to the current minimum wage laws. The first I will stress is that the minimum wage should stay in the hands of LPC, as the technocratic element of it has meant that general employment hasn’t been massively effected by the bite of the minimum wage. With the Chancellor in effect politicising the minimum wage, I think we could see more unemployment and underemployment effects due to unfunded increases, such as the OBRs prediction of 60,000 job losses.
We should regionalise the minimum wage, as its bite effect is felt much more in the Midlands and North of England than London and South East. Youth unemployment for the former areas is much higher than it is in the latter. I also think we could look into optionalising the minimum wage for teenage and young workers, specifically 16-21 year olds, and scrapping the specific rates for these age groups. The bite effect felt by employees of this age is much higher for employers, and discourages employment as well as causes a significant reduction in hours. This would see more youth employment, as well as more flexibility and training for young workers, thus increasing their employability and reducing their economic precarity.
In the long run, we may see these effects amplified. A recent article in The Economist has shown how continued increases in the minimum wage may result in larger unemployment, labour-capital substitution occurs. It notes three studies which show that while short-term increases may not cause large problems, in the long-run the effect could be significantly amplified. They showed that in the restaurant industry, job growth is negatively affected, resulting in more business closures and a dominance of larger chains that are more likely to use technology over labour. These sorts of employment and growth were also shown to be general within labour markets, meaning year on year job growth and employment are slowed as the minimum wage goes up, which has a deleterious effect on the lowest-skilled and youngest in a labour market (The Economist, 2015). If we want these trends to continue, then politicians should continue with politically-motivated wage hikes. However, if we want to see better job growth and more productive employment, we need to reform the minimum wage, making it job-friendly. Further, the labour market needs to be freed from costly regulations, allowing for full employment within a free market.
Index
1.
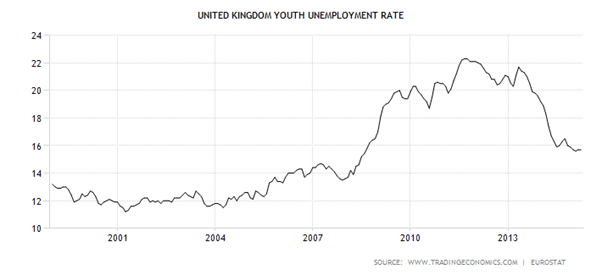
Source: Trading Economics – http://www.tradingeconomics.com/united-kingdom/youth-unemployment-rate
2.
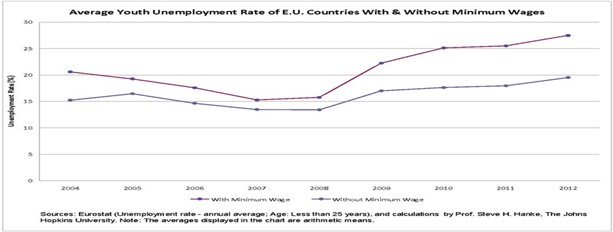
Source: Business Insider – http://www.businessinsider.com/case-against-raising-the-minimum-wage-2014-3?IR=T
3.
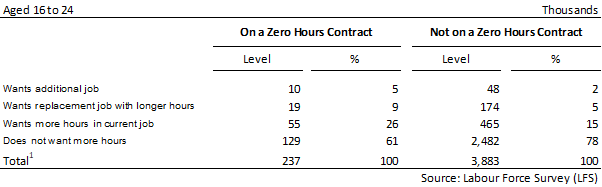
Source: ONS – http://www.ons.gov.uk/ons/about-ons/business-transparency/freedom-of-information/what-can-i-request/published-ad-hoc-data/labour/may-2015/index.html; 004131
11 May 2015
4.
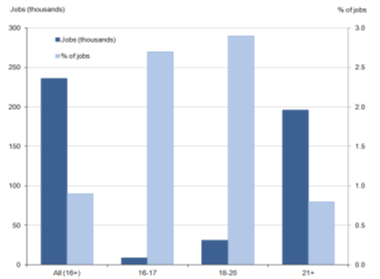
Source: ONS, 2014, 3
Bibliography
Banerji, A., Saksonovs, S., Lin, H. & Blavy, R. (2014). Youth Unemployment in Advanced Economies in Europe: Searching for Solutions. Available: http://www.imf.org/external/pubs/ft/sdn/2014/sdn1411.pdf. Last accessed 28th Jul 2015.
Bourne, R. & Shackleton, J.R. (2014). The Minimum Wage: Silver Bullet or Poisoned Chalice?. Available: http://www.iea.org.uk/sites/default/files/publications/files/Briefing%20-%20Minimum%20Wage.pdf. Last accessed 30th Jul 2015.
Brown, C., Gilroy, C. & Kohen, A. (1982). The Effect of The Minimum Wage on Employment and Unemployment. Journal of Economic Literature. 20 (2), 487-528.
Bryan, M., Salvatori, A. & Taylor, M. (2012). The Impact of the National Minimum Wage on Earnings, Employment and Hours through the Recession. Available: https://www.gov.uk/government/uploads/system/uploads/attachment_data/file/227028/National_minimum_wage-_impact_on_earnings__employment_and_hours_in_the_recession.pdf. Last accessed 28th Jul 2015.
CPC. (2014). Measuring economic precarity among UK youth during the recession. Available: http://www.cpc.ac.uk/publications/cpc_briefing_papers/pdf/BP22_Measuring_economic_precarity.pdf. Last accessed 29th Jul 2015.
Dar, A. (2015). Youth Unemployment Statistics. House of Commons Library. 05871, 1-4.
Gov.uk. (2014). National Minimum Wage rates. Available: https://www.gov.uk/national-minimum-wage-rates. Last accessed 29th Jul 2015.
Hanke, S. (2014). These Charts Show How Raising The Minimum Wage Comes With Higher Unemployment. Available: http://www.businessinsider.com/case-against-raising-the-minimum-wage-2014-3?IR=T. Last accessed 27th Jul 2015.
IPPR. (2010). Trends in part-time and temporary work. Available: http://www.ippr.org/files/uploadedFiles/pressreleases/Part-time%20and%20temporary%20work%20technical%20briefing.pdf?noredirect=1. Last accessed 28th Jul 2015.
LPC (2008). National Minimum Wage Low Pay Commission Report 2008. London: LPC.
LPC (2014). The Future Path of the National Minimum Wage. London: LPC.
Neumark, D. (2014). Employment effects of minimum wages. IZA World of Labor. 6, 1-10.
Neumark, D. & Wascher, W. (1998). Minimum Wages and Training Revisited. NBER. 6651, 1-36.
Neumark, D. & Wascher, W. (2003). Minimum Wages, Labor Market Institutions, and Youth Employment. Available: http://www.federalreserve.gov/pubs/feds/2003/200323/200323pap.pdf. Last accessed 28th Jul 2015.
ONS. (2012). Young People in Work, 2012. Available: http://www.ons.gov.uk/ons/dcp171776_257979.pdf. Last accessed 29th Jul 2015.
ONS. (2014). Low Pay, April 2014. Available: http://www.ons.gov.uk/ons/dcp171778_385432.pdf. Last accessed 30th Jul 2015.
ONS. (2015). Published ad hoc data: labour market, requests during May 2015. Available: http://www.ons.gov.uk/ons/about-ons/business-transparency/freedom-of-information/what-can-i-request/published-ad-hoc-data/labour/may-2015/index.html. Last accessed 30th Jul 2015.
The Economist. (2015). Destination Unknown. Available: http://www.economist.com/news/finance-and-economics/21659714-large-increases-minimum-wage-could-have-severe-long-term-effects-destination. Last accessed 2nd Aug 2015.
Trading Economics. (2015). United Kingdom Youth Unemployment Rate. Available: http://www.tradingeconomics.com/united-kingdom/youth-unemployment-rate. Last accessed 27th Jul 2015.
Worstall, T. (2012). Message to the TUC: the minimum wage causes youth unemployment. Available: http://blogs.telegraph.co.uk/finance/timworstall/100018044/message-to-the-tuc-the-minimum-wage-causes-youth-unemployment/. Last accessed 27th Jul 2015.
Y Charts. (2015). Germany Youth Unemployment Rate. Available: https://ycharts.com/indicators/germany_youth_unemployment_rate_lfs. Last accessed 27th Jul 2015.
[1] Own calculation made through ONS data at http://www.ons.gov.uk/ons/about-ons/business-transparency/freedom-of-information/what-can-i-request/published-ad-hoc-data/labour/may-2015/index.html – 004172 21 May 2015
[2] http://www.ons.gov.uk/ons/about-ons/business-transparency/freedom-of-information/what-can-i-request/published-ad-hoc-data/labour/may-2015/index.html – 004172 21 May 2015

Also published here: https://www.academia.edu/14859108/The_Negative_Effects_of_the_Minimum_Wage_on_Non-University_Educated_18-21_Year_Olds_in_the_UK
LikeLike
[…] [2] https://collapsepatchworks.com/2015/10/30/the-negative-effects-of-the-minimum-wage-on-non-university… […]
LikeLike
[…] [2] https://collapsepatchworks.com/2015/10/30/the-negative-effects-of-the-minimum-wage-on-non-university… […]
LikeLike